Interactive visualisations of colour changes from spectrophotometer measurements
This page presents interactive data visualisations from research on the solarisation of manganese-containing historical glass, manganese was used as a decolourant in glass making. This study investigates how different UV light sources affect colour changes in glass samples over time.
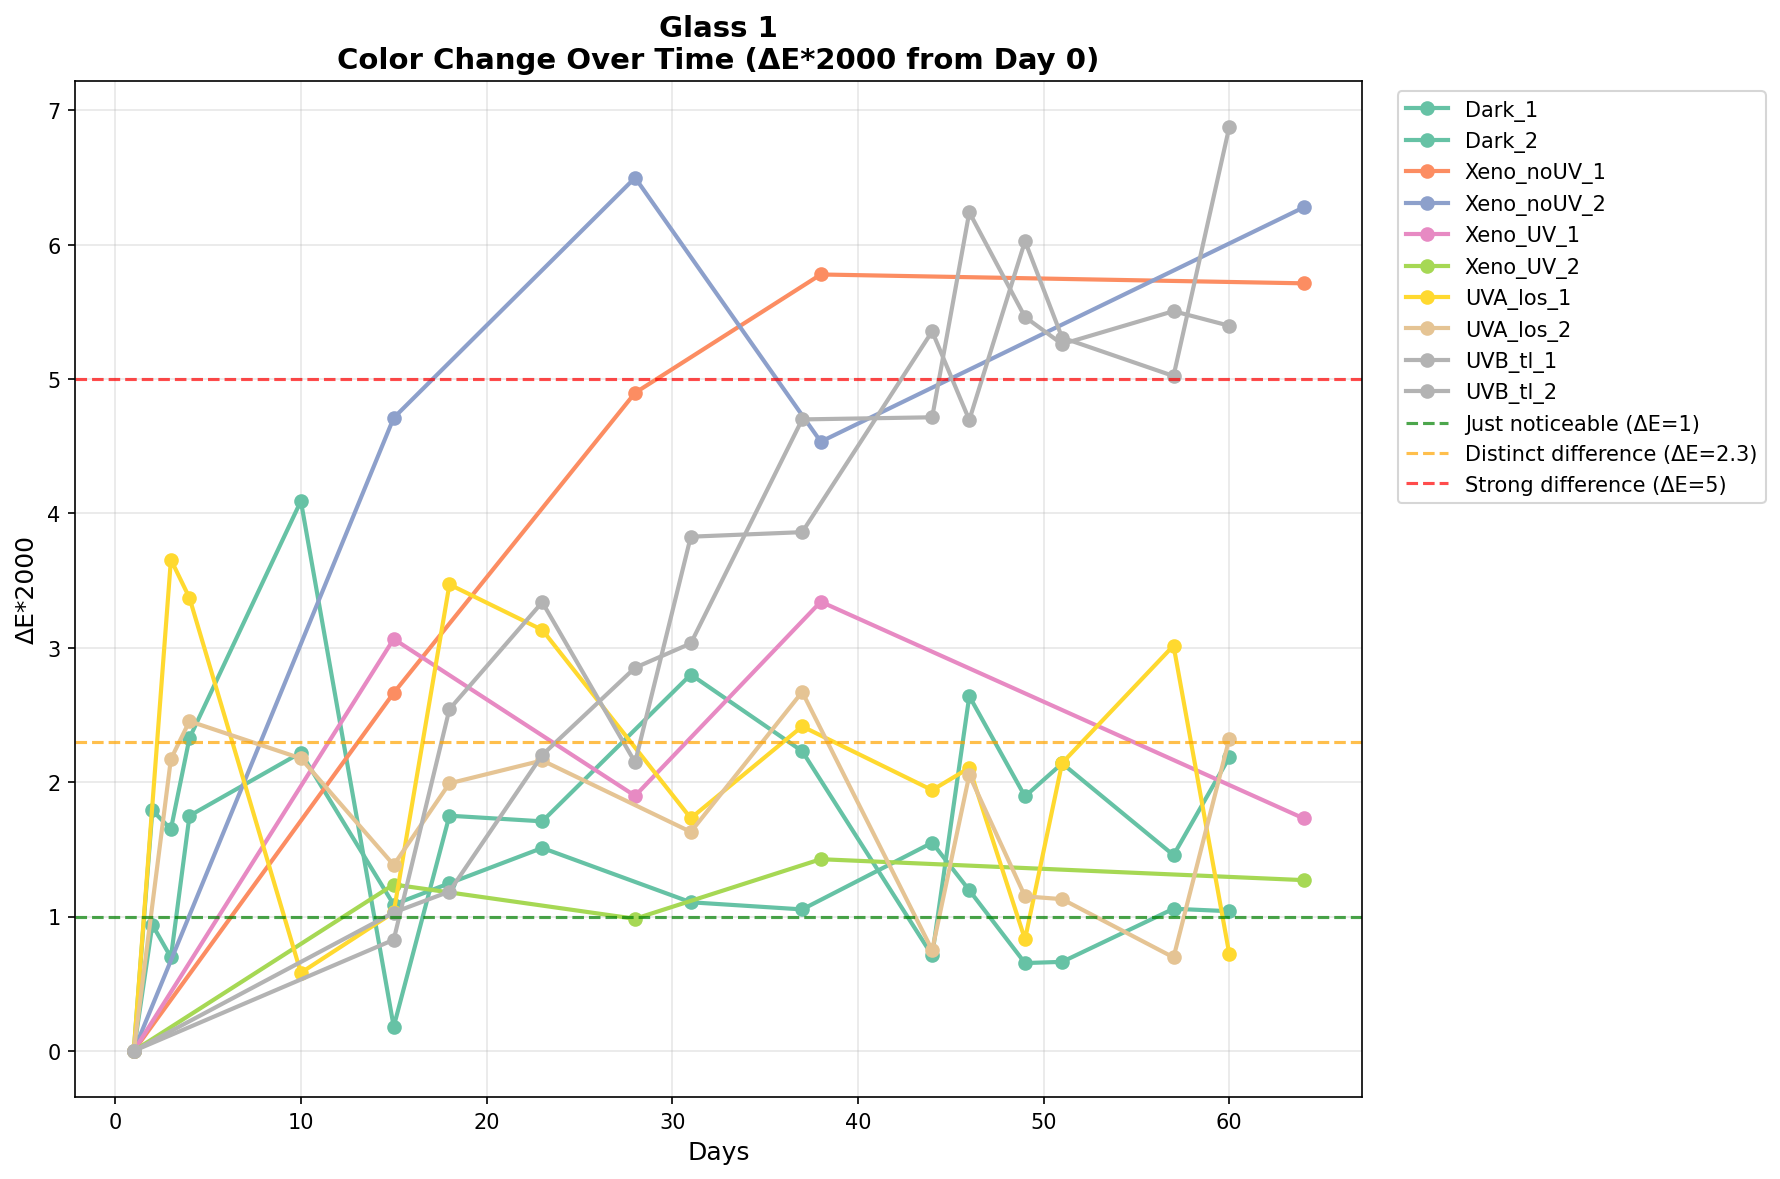
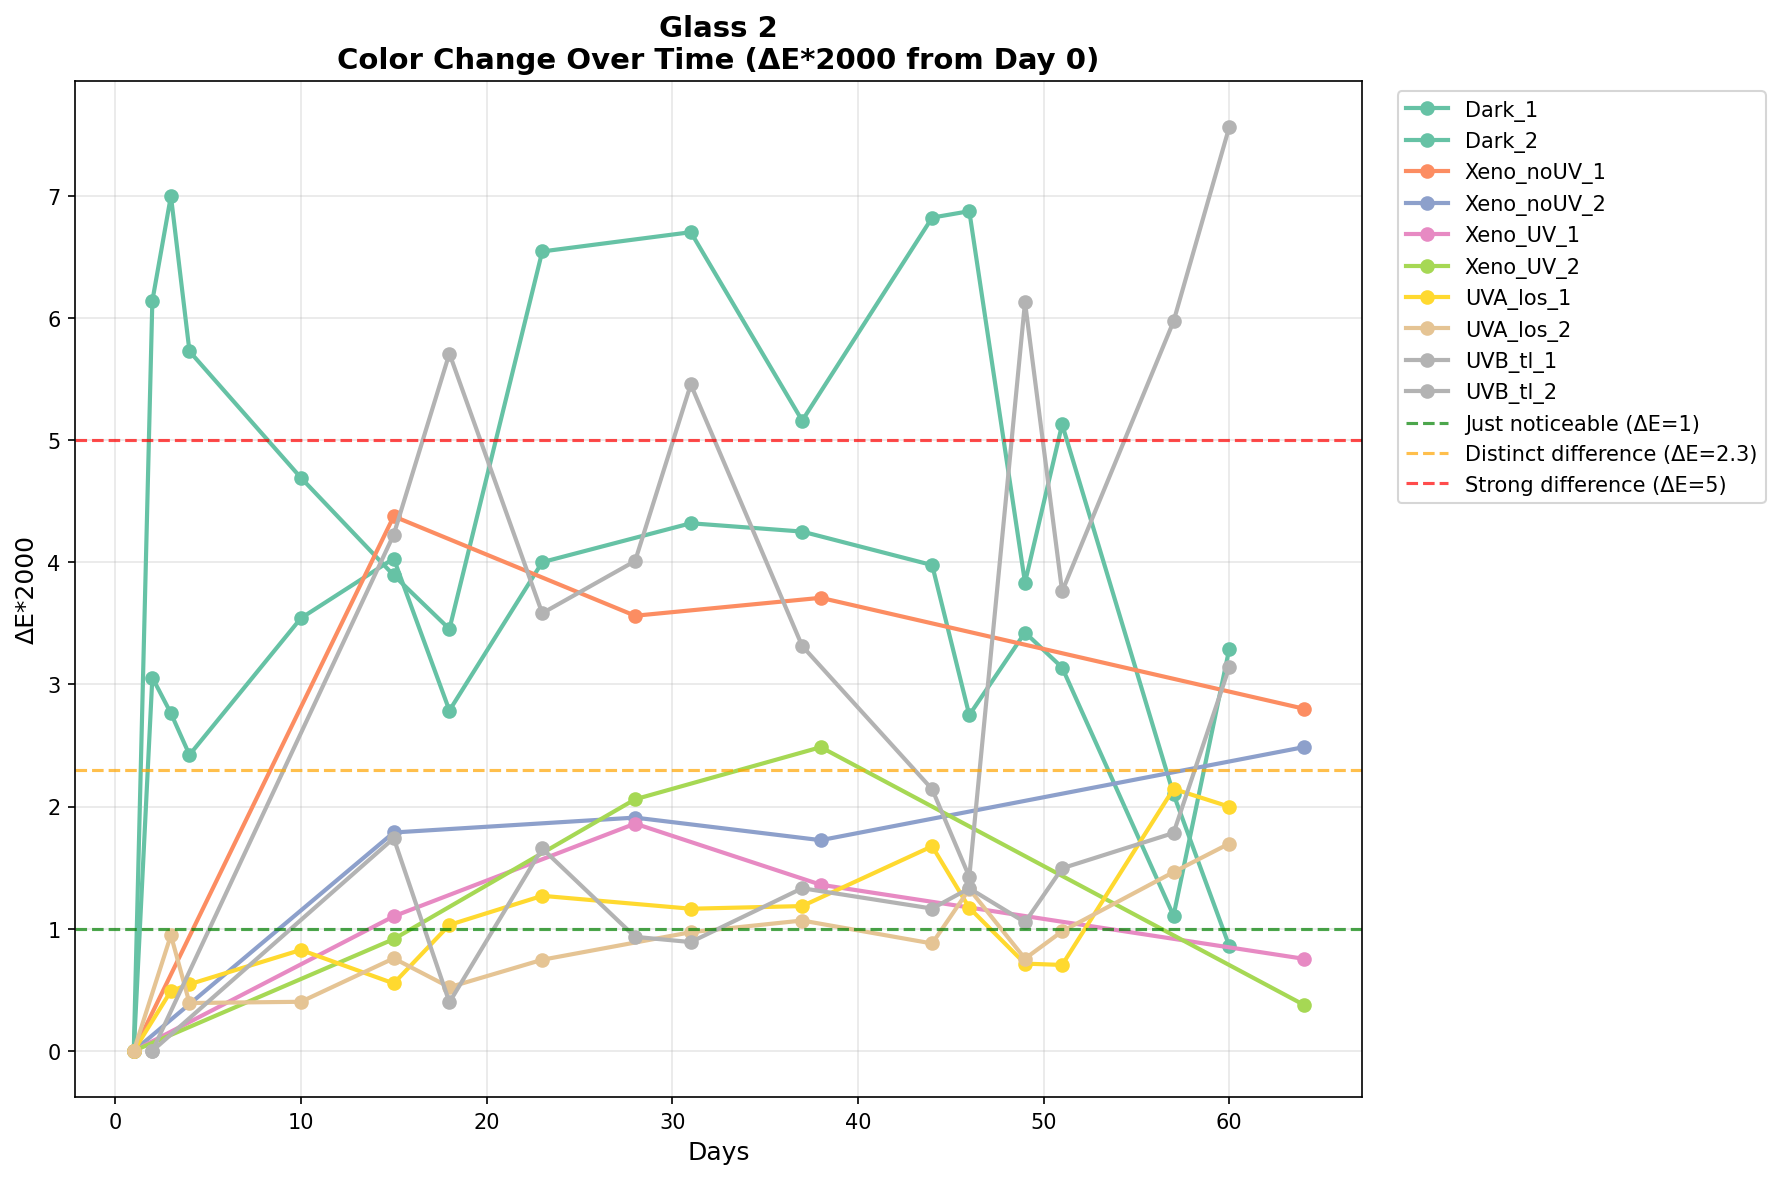
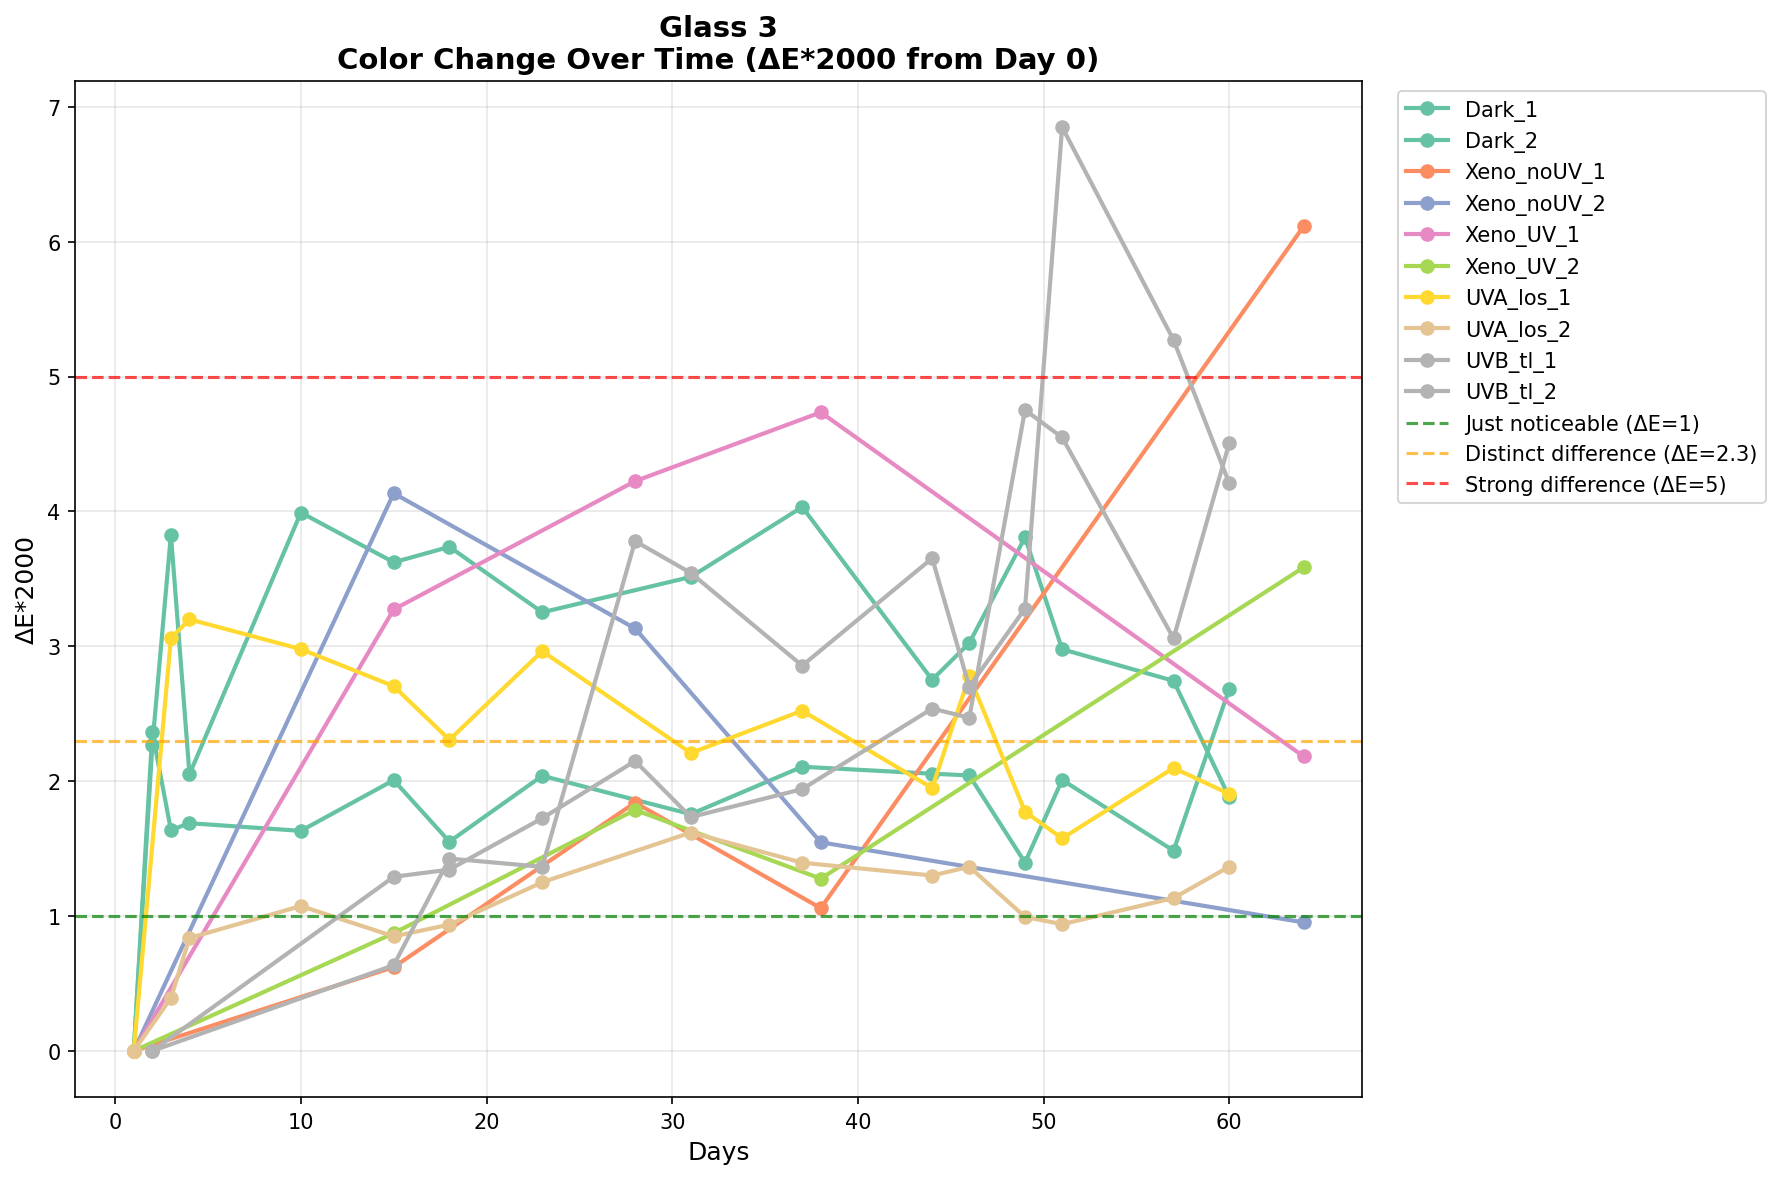
The graphs below display colourimetric measurements taken using a spectrophotometer, tracking changes in the CIELAB colour space (L*, a*, b*) and calculating ΔE₀₀ colour difference values. Since the measured glass samples were not all equally flat and thick, there was a substantial amount of measurement errors. Therefore, some glasses seem to have discoloured based on the ΔE₀₀ while visually they have not, or the other way around. Visually, sample exposed to UVB of glass 1 and glass 3 and samples exposed to UVA of glass 1 have solarised. None of the samples exposed to the Xenotest without solarised, but still the final ΔE₀₀ for these samples of glass 1 and 3. si relatively high. Looking at the ΔE₀₀, it also looks like some of the samples kept in the dark have solarised, this is obviously not the case.
While all irradiation conditions were affected by measurement errors due to the curvature of the glass samples, in the UVB condition the extent of solarisation was sufficient to be clearly detectable both visually and through the ΔE₀₀ values (in case study glasses 1 and 3).
Use the interactive charts to explore the data. Hover over data points in the ΔE₀₀ charts to see comparison photos of the samples at Day 1 and the selected measurement day (where images are available).
Chemical composition of the three case study glasses determined by Energy-dispersive X-ray spectroscopy (EDX).
| Sample | SiO₂ | Na₂O | MgO | K₂O | CaO | MnO | Fe₂O₃ | Cl | SO₃ | Total |
|---|---|---|---|---|---|---|---|---|---|---|
| Glass 1 | 76.9 ±0.1 | 17.3 ±0.4 | 2.2 ±0.0 | ND | 3.4 ±0.1 | 0.2 ±0.2 | 0.0 ±0.0 | 0.1 ±0.1 | ND | 100.0 |
| Glass 2 | 74.6 ±0.0 | 0.9 ±0.1 | ND | 15.2 ±0.2 | 9.0 ±0.0 | 0.1 ±0.1 | 0.1 ±0.0 | ND | ND | 100.0 |
| Glass 3 | 74.9 ±0.1 | 0.7 ±0.0 | 0.0 ±0.0 | 15.7 ±0.0 | 8.5 ±0.1 | 0.2 ±0.0 | 0.1 ±0.1 | 0.0 ±0.1 | 0.1 ±0.2 | 100.1 |
ND = Not Detected (element not present in the glass composition). 0.0 = Element present but concentration too low to accurately estimate. Values in wt%. Standard deviation shown as ±StDev.
The aim of the SEM-EDX analysis was to have a more accurate measurement of the chemical composition of the case study objects. The semi-quantitative results of EDX analysis are presented in the graphs above. Because the samples were embedded in epoxy resin, EDX showed a high percentage of carbon (C) present. As this cannot be in the glass composition, the results were normalised by removing the C values and re-calculating the wt% of the other elements.
The graphs show the average wt% of two measurements per case study object, where Mn and Fe were targeted specifically. There were some interesting differences in the EDX results when analysis was performed with or without specifying the identification of Mn and Fe. Specifically, when the identification of manganese was not specified during EDX analysis, the wt% of manganese was too low to be detected as a major element.
When comparing the compositions of the three case study objects, it stands out that case study object 2 and case study object 3 showed minimal differences, while case study object 1 seemed to have a distinct composition. For example, the proportion of sodium (Na) and magnesium (Mg) was significantly higher in case study object 1 than in 2 and 3. In addition, both case study objects 2 and 3 consisted mainly of Na2O, SiO2, K2O, CaO, whereas in case study object 1, K2O was not detected at all.
Although there were a lot of similarities between case study object 2 and 3, the EDX results also show some minor compositional differences. The most noticeable difference was that case study object 3 contained traces of sulphur trioxide (SO3) and chlorine (Cl). The EDX result of Cl was 0.0, which means that the average wt% was too low to accurately estimate with EDX, but the element was still detected in the glass composition. If the element was not present in the glass composition, the result would have been ‘not detected’ (ND). Chlorine was also found in case study object 1, but was not detected in case study object 2.
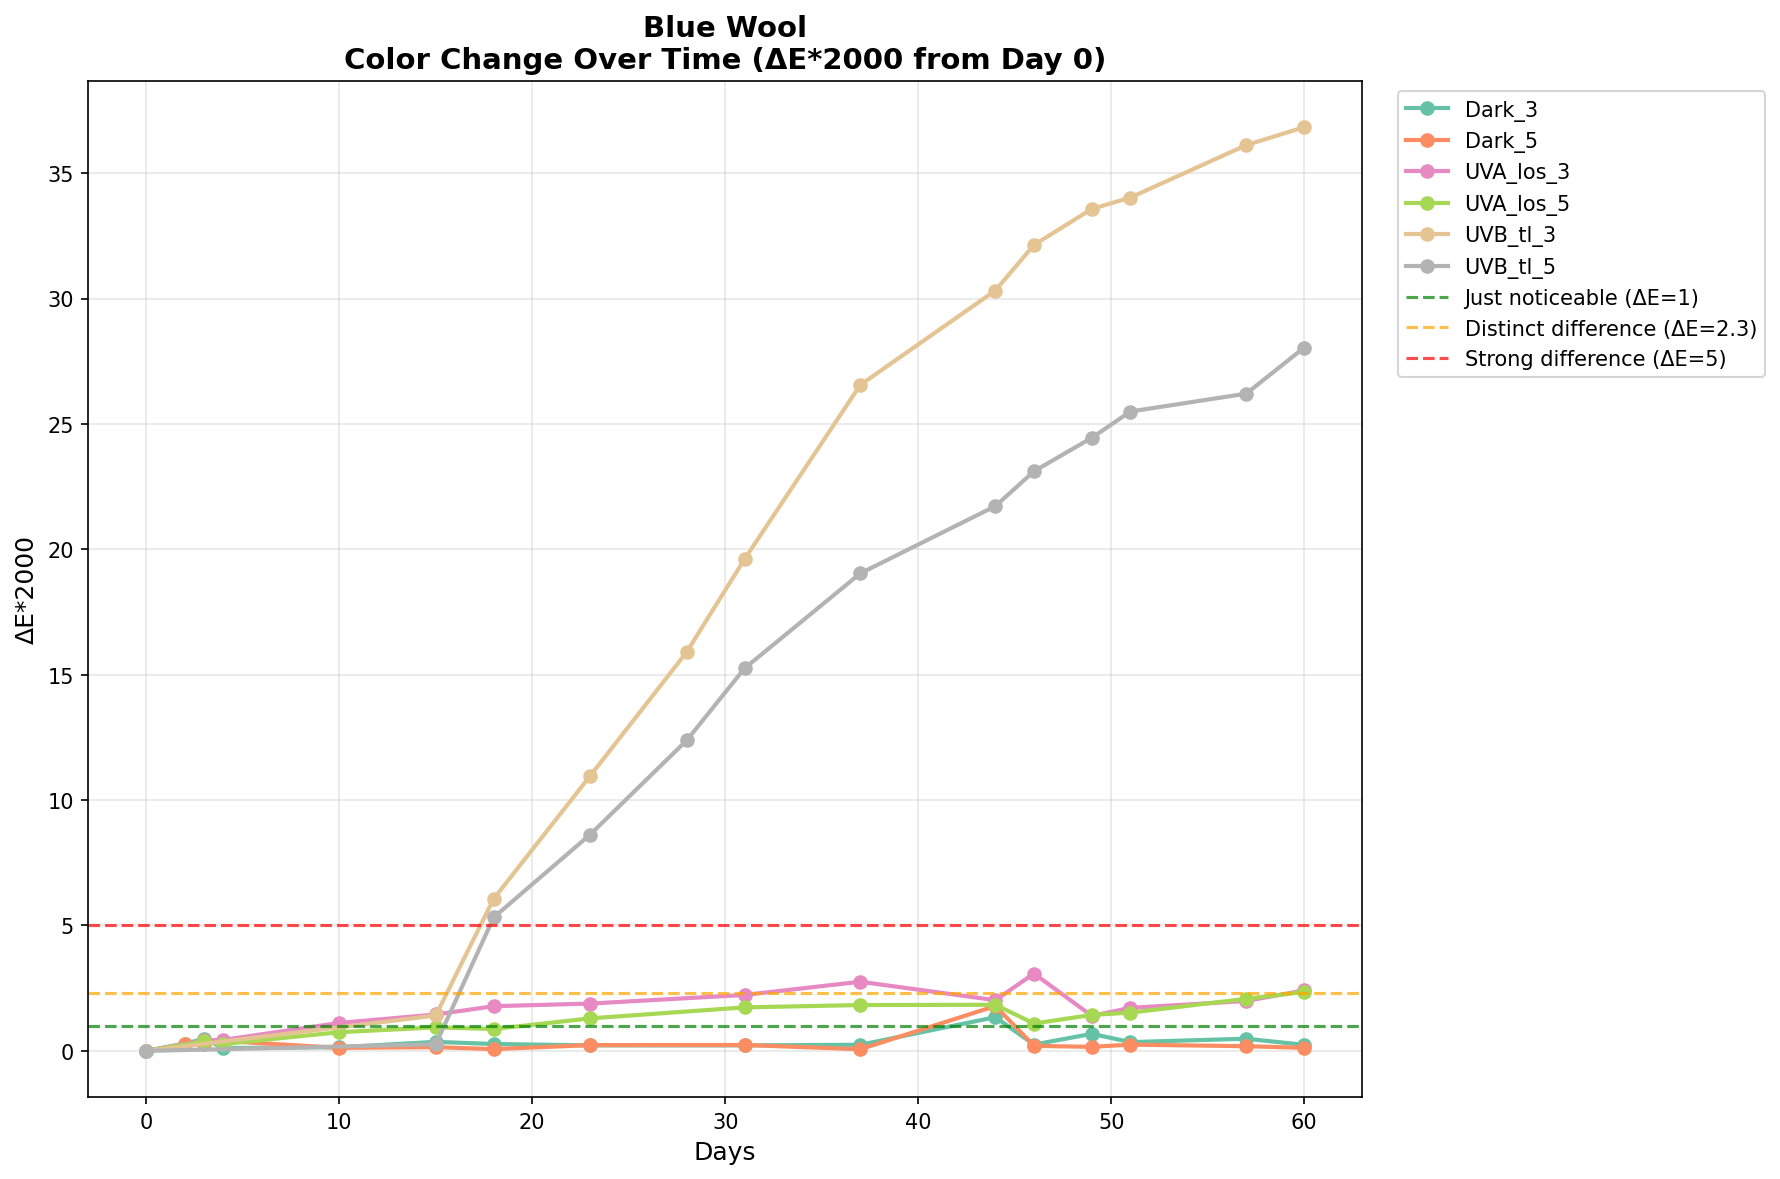
Track how colours change over time using the ΔE*2000 metric (CIEDE2000).
colour change over time
colour change over time
colour change over time
colour change over time
Comparative view
View all sample photographs in chronological order.
Detailed 3D trajectories for each individual sample.
Glass 1
Glass 1
Glass 1
Glass 1
Glass 1
Glass 1
Glass 1
Glass 1
Glass 1
Glass 1
Glass 2
Glass 2
Glass 2
Glass 2
Glass 2
Glass 2
Glass 2
Glass 2
Glass 2
Glass 2
Glass 3
Glass 3
Glass 3
Glass 3
Glass 3
Glass 3
Glass 3
Glass 3
Glass 3
Glass 3
Blue Wool
Blue Wool
Blue Wool
Blue Wool
Blue Wool
Blue Wool